PRANA
00:00:00 WITA

Insight-PTN

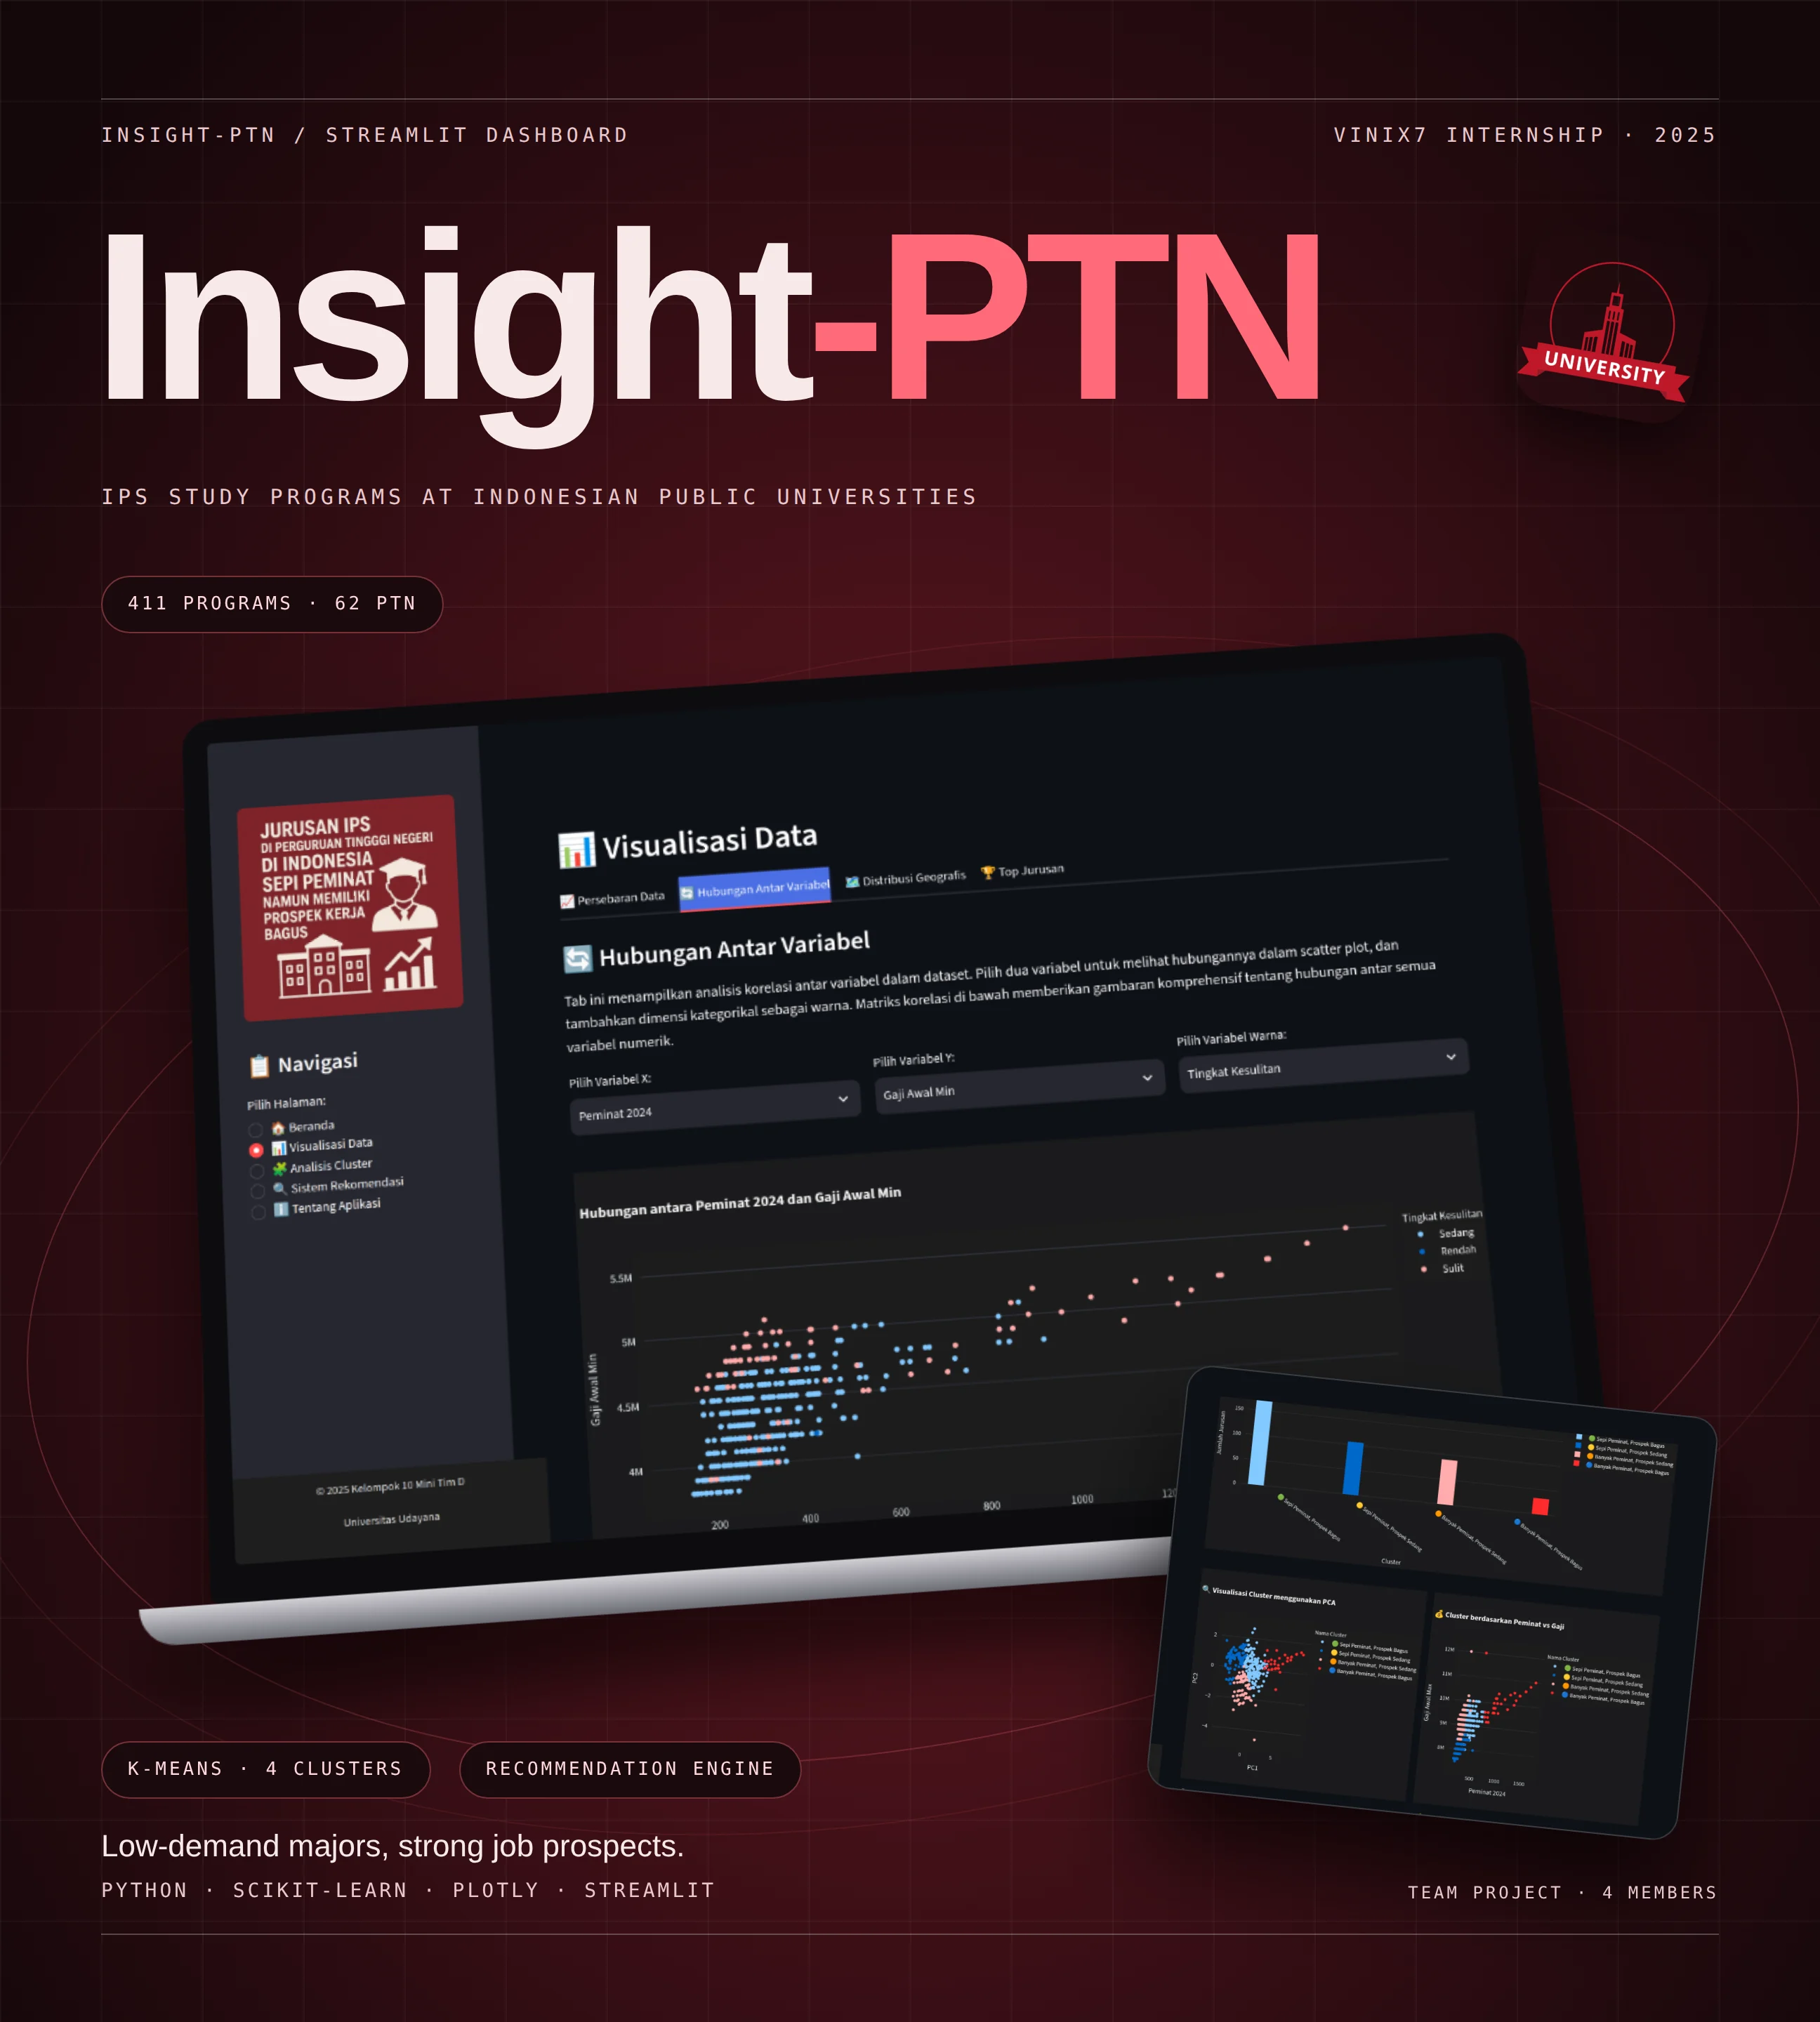
An interactive Streamlit dashboard that analyzes 411 social-science (IPS) study programs across 62 Indonesian public universities to surface programs with fewer applicants but strong job prospects.

(Year)
2025
(Role)
Junior Data Science Intern
(Stack)
  • Python
  • pandas
  • scikit-learn
  • Plotly
  • Streamlit
(Type)
Internship Team Project / Data Dashboard

Insight-PTN dashboard presentation showing the data visualization page on a laptop and the cluster analysis page on a tilted screen, on a dark maroon background.
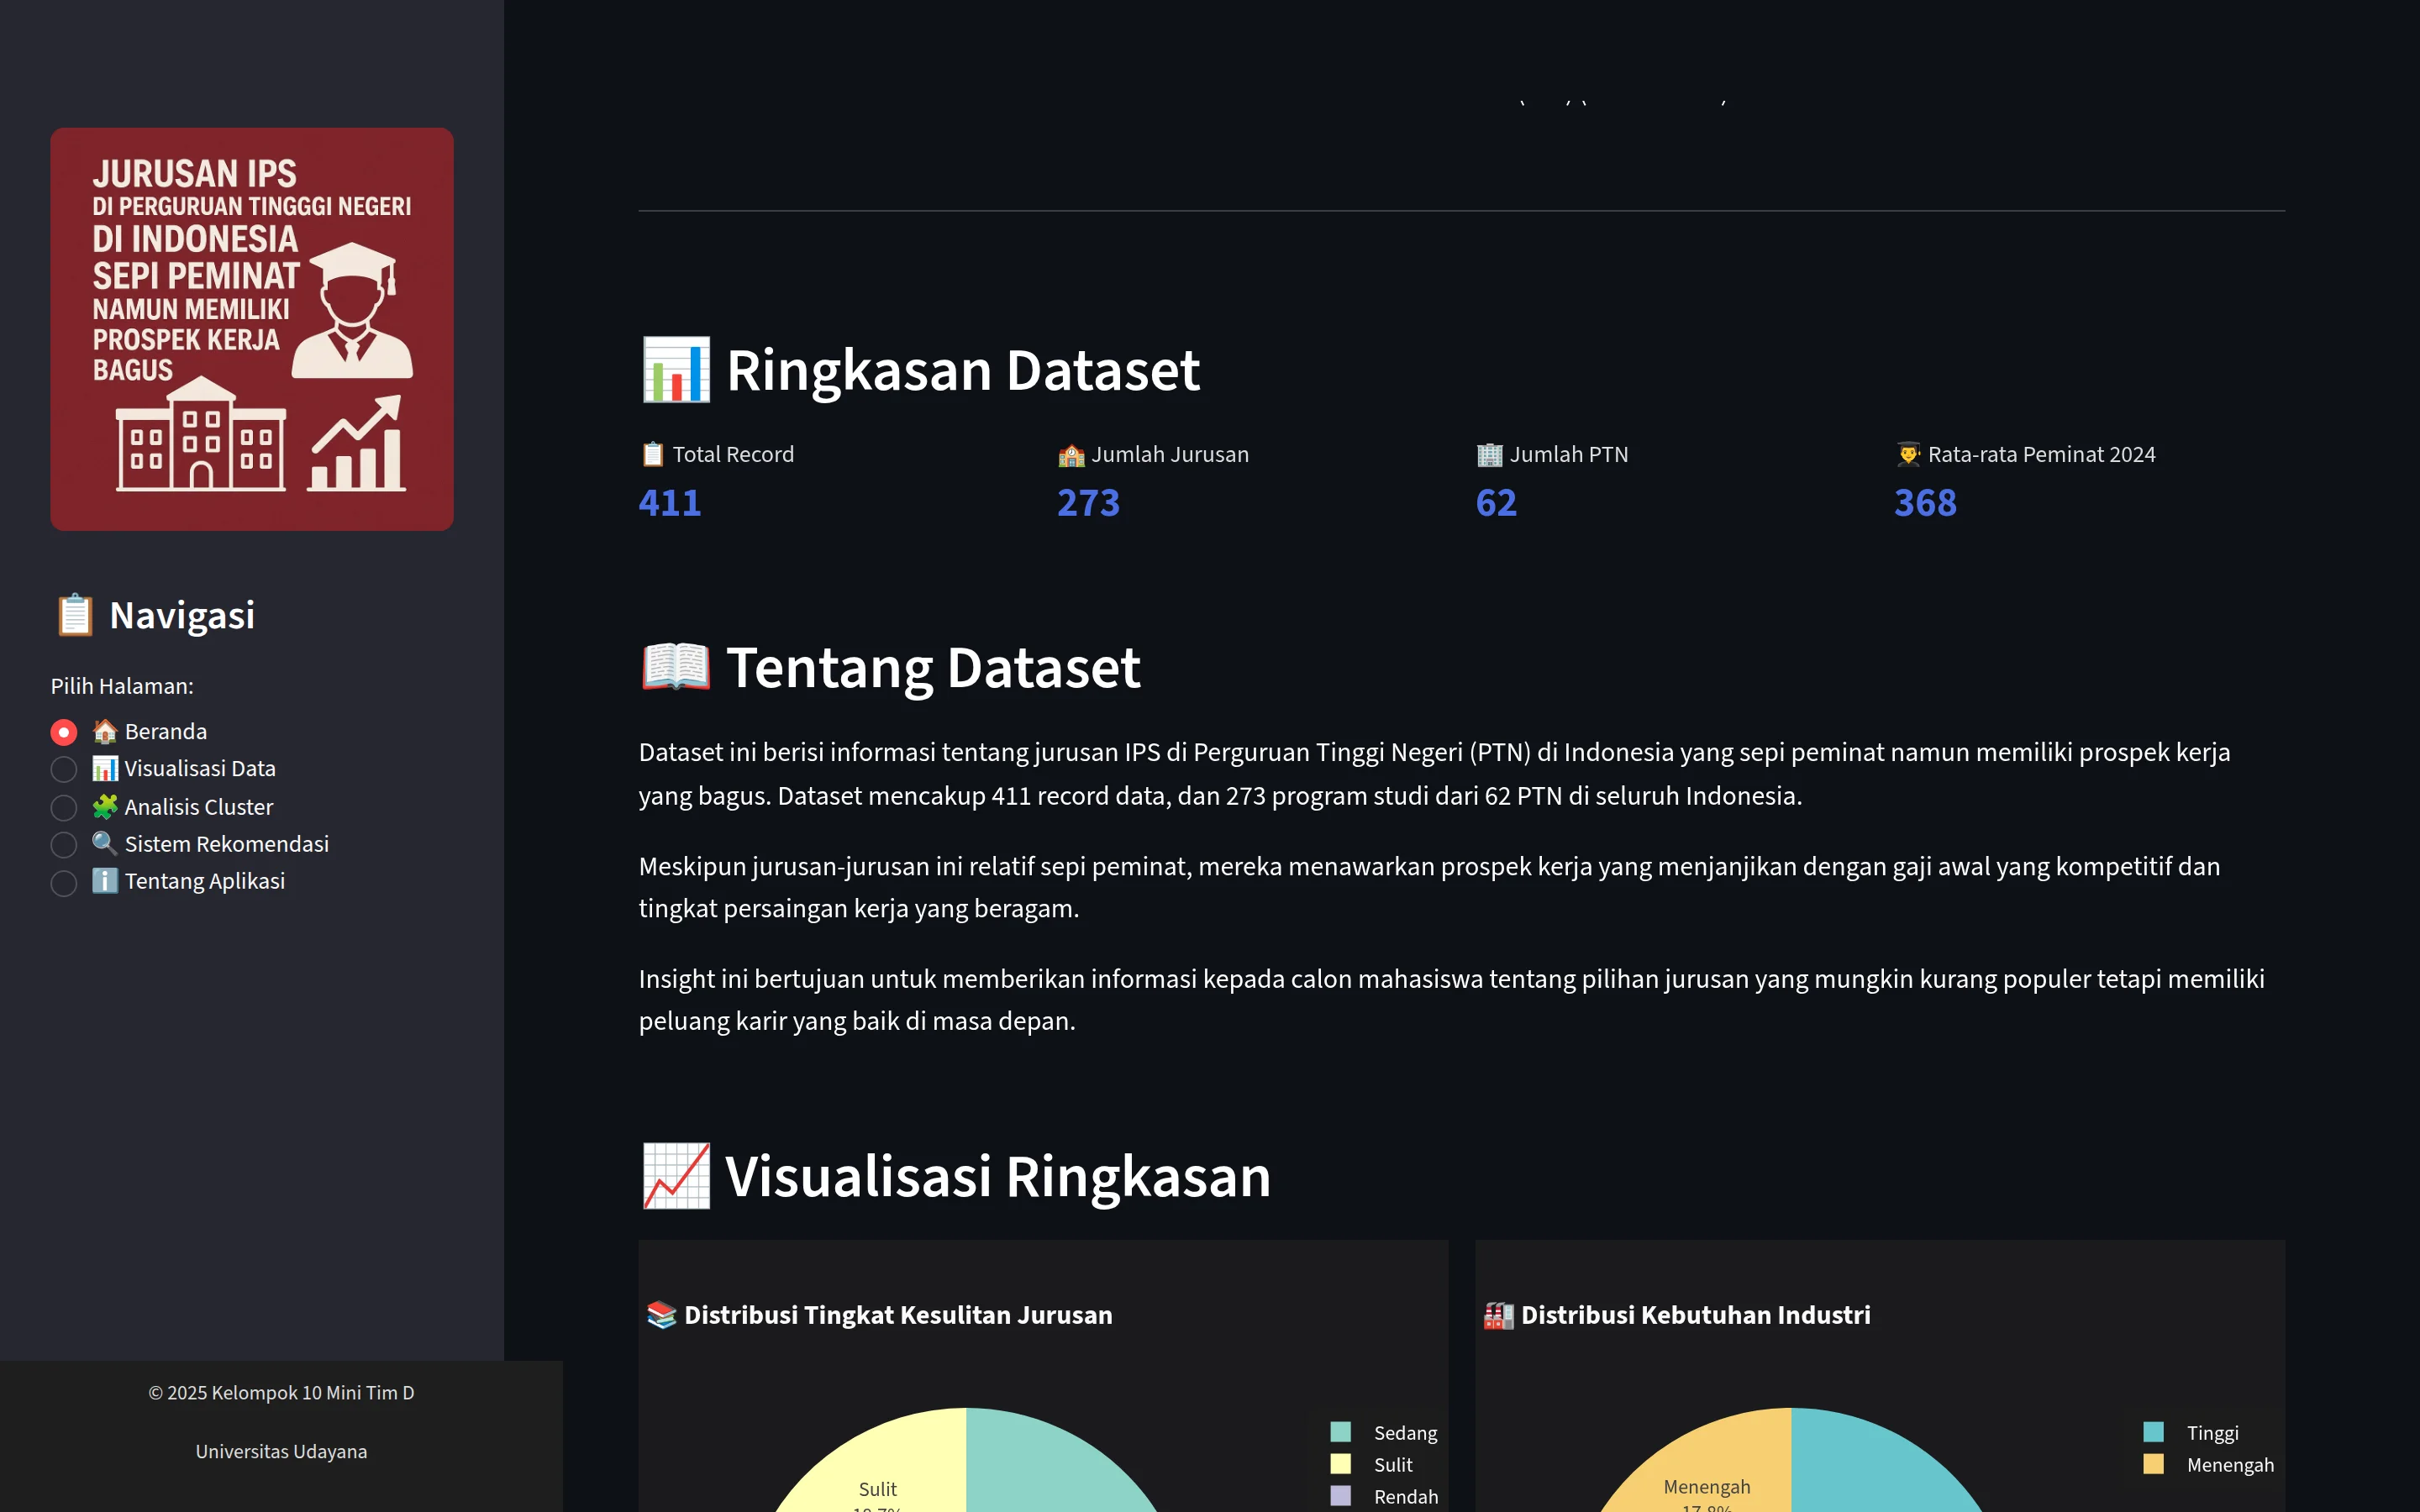
Insight-PTN home page dataset summary: 411 records, 273 study programs, 62 public universities and an average of 368 applicants, with dataset notes.
(Problem)

Prospective students tend to compete for the same popular programs, while less crowded IPS programs with good career outcomes are hard to find in one place.

(Approach)

Built during my PT Vinix Seven Aurum (VINIX7) internship as a 4-person team under mentor Musayyanah. The dashboard groups programs with K-Means into 4 clusters, maps them across Indonesia, ranks top programs and recommends programs from user preferences such as applicant count, salary, location and difficulty. I applied the clustering and built the recommendation and visualization features.

(Result)

A public Streamlit app with five pages: overview, data visualization, cluster analysis, recommendations and an about guide. Data comes from university pages and other public sources and is meant as a reference to confirm with official sources, not a final admission decision.
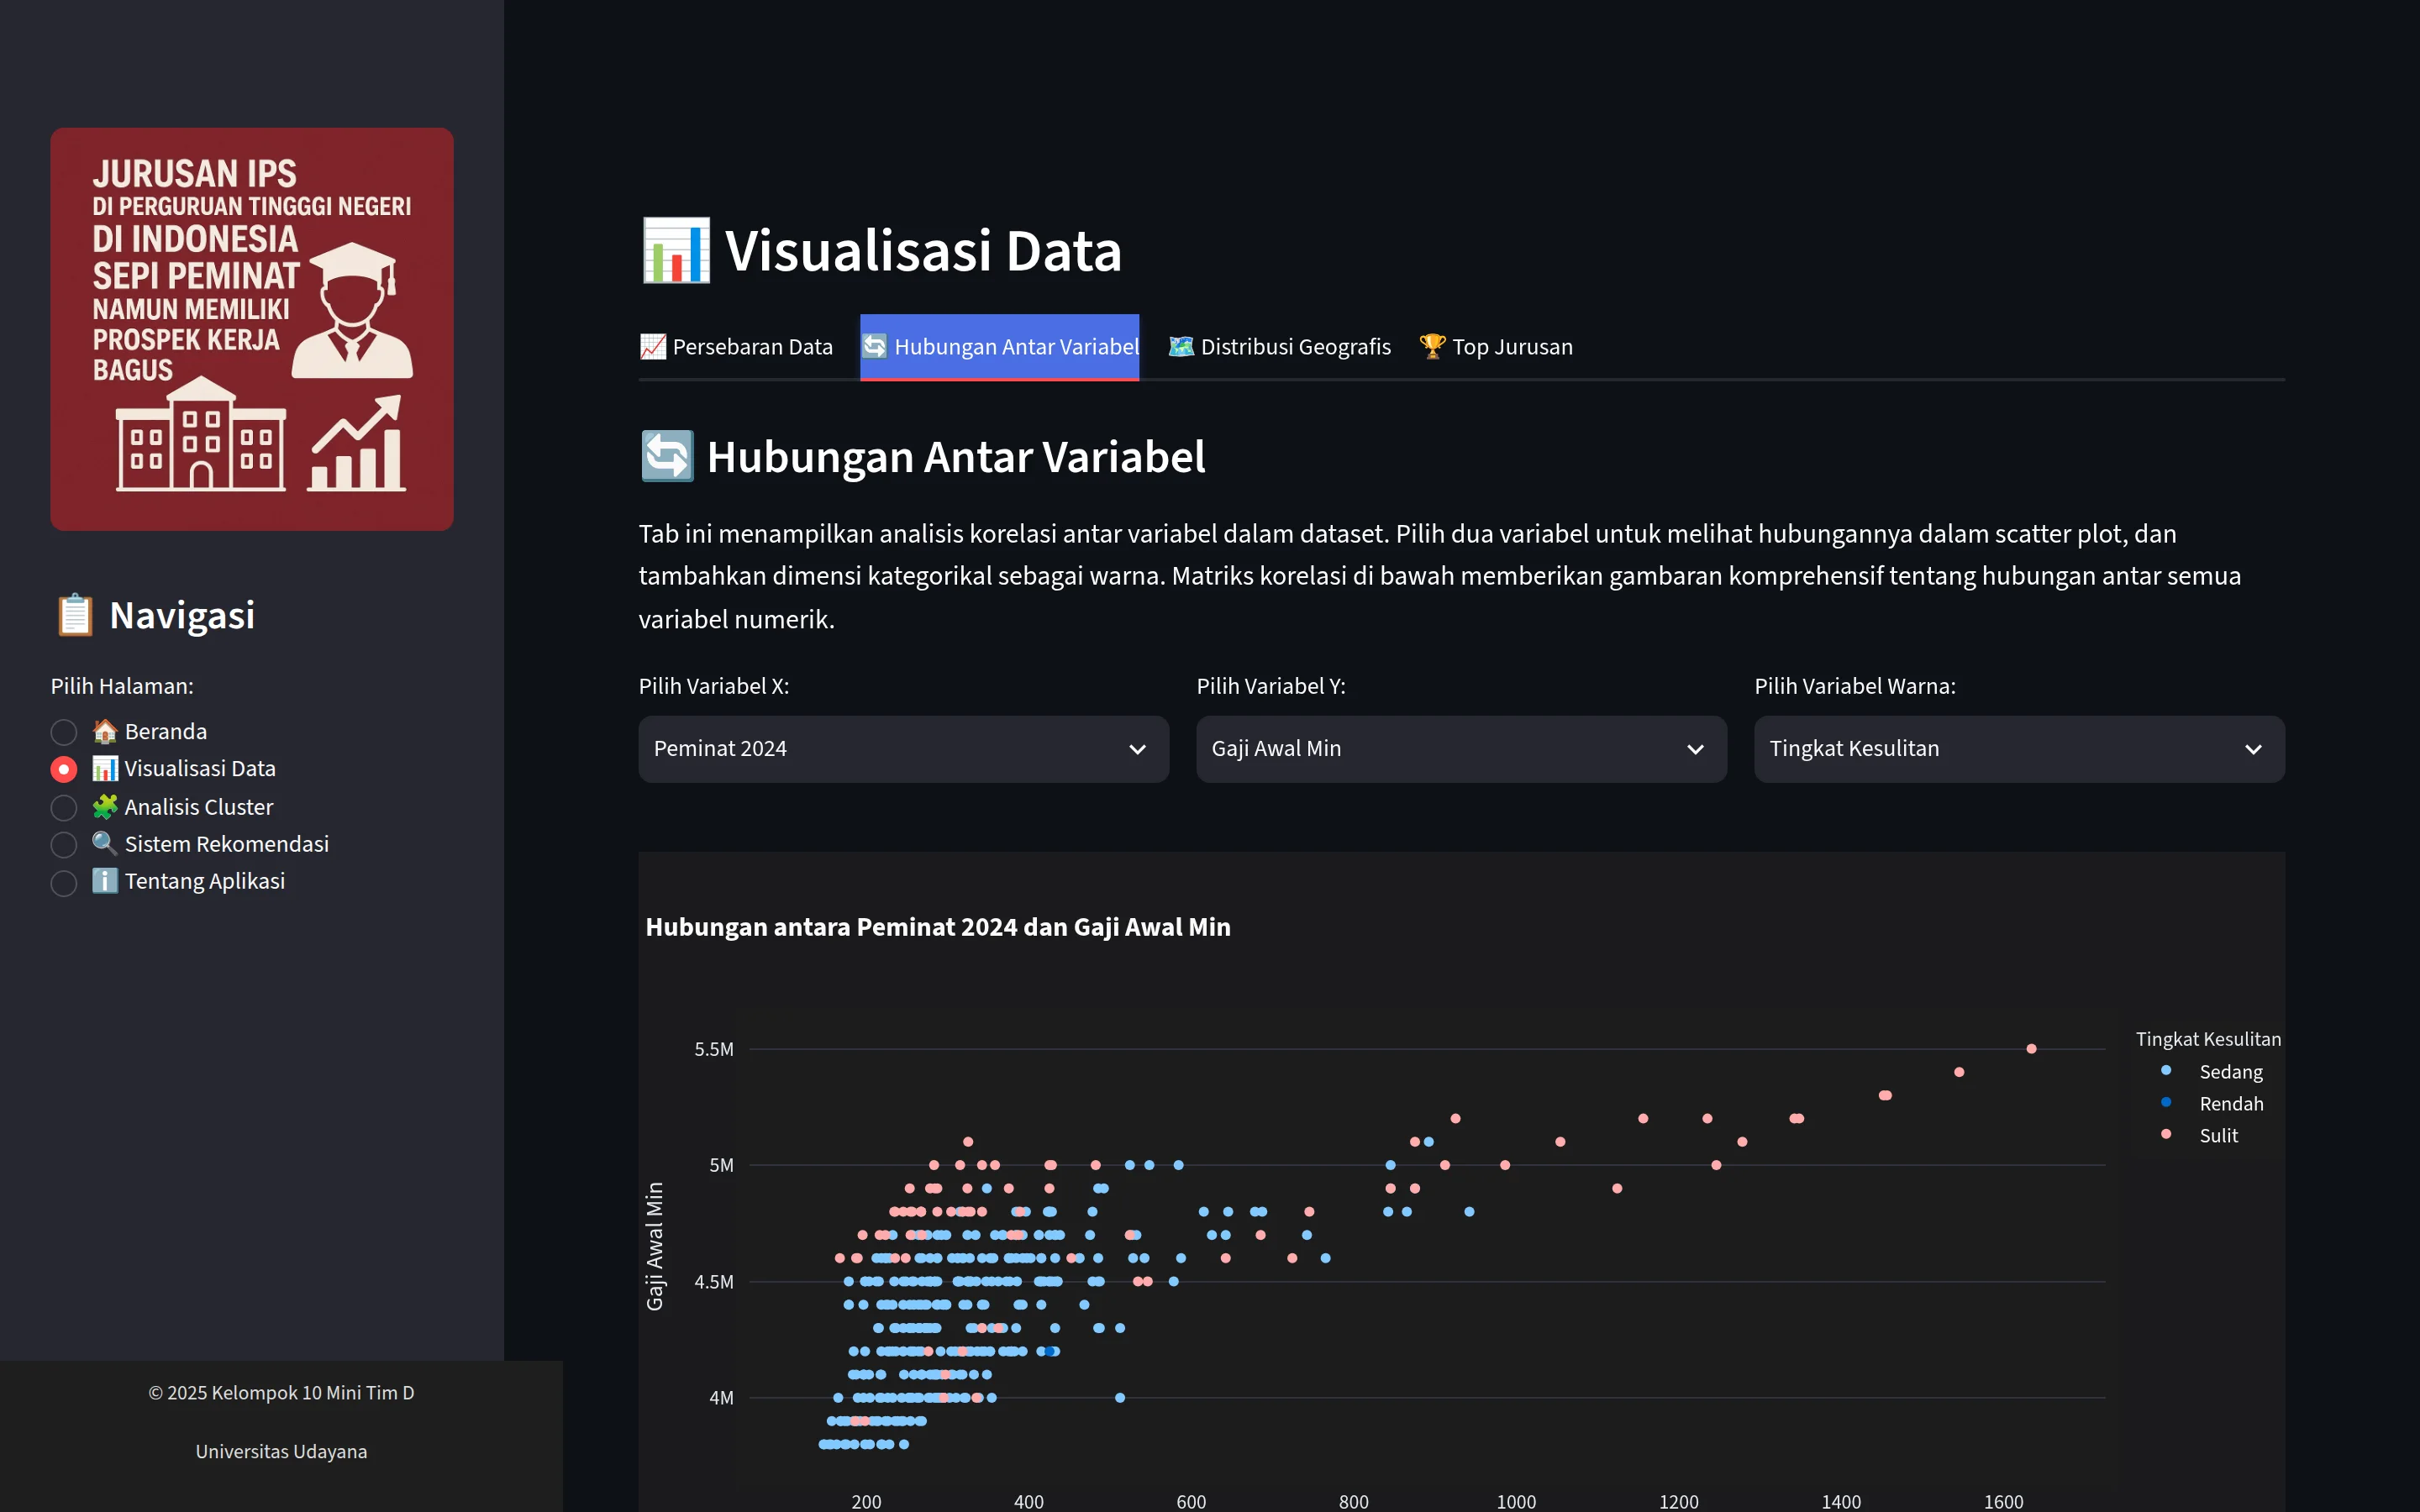
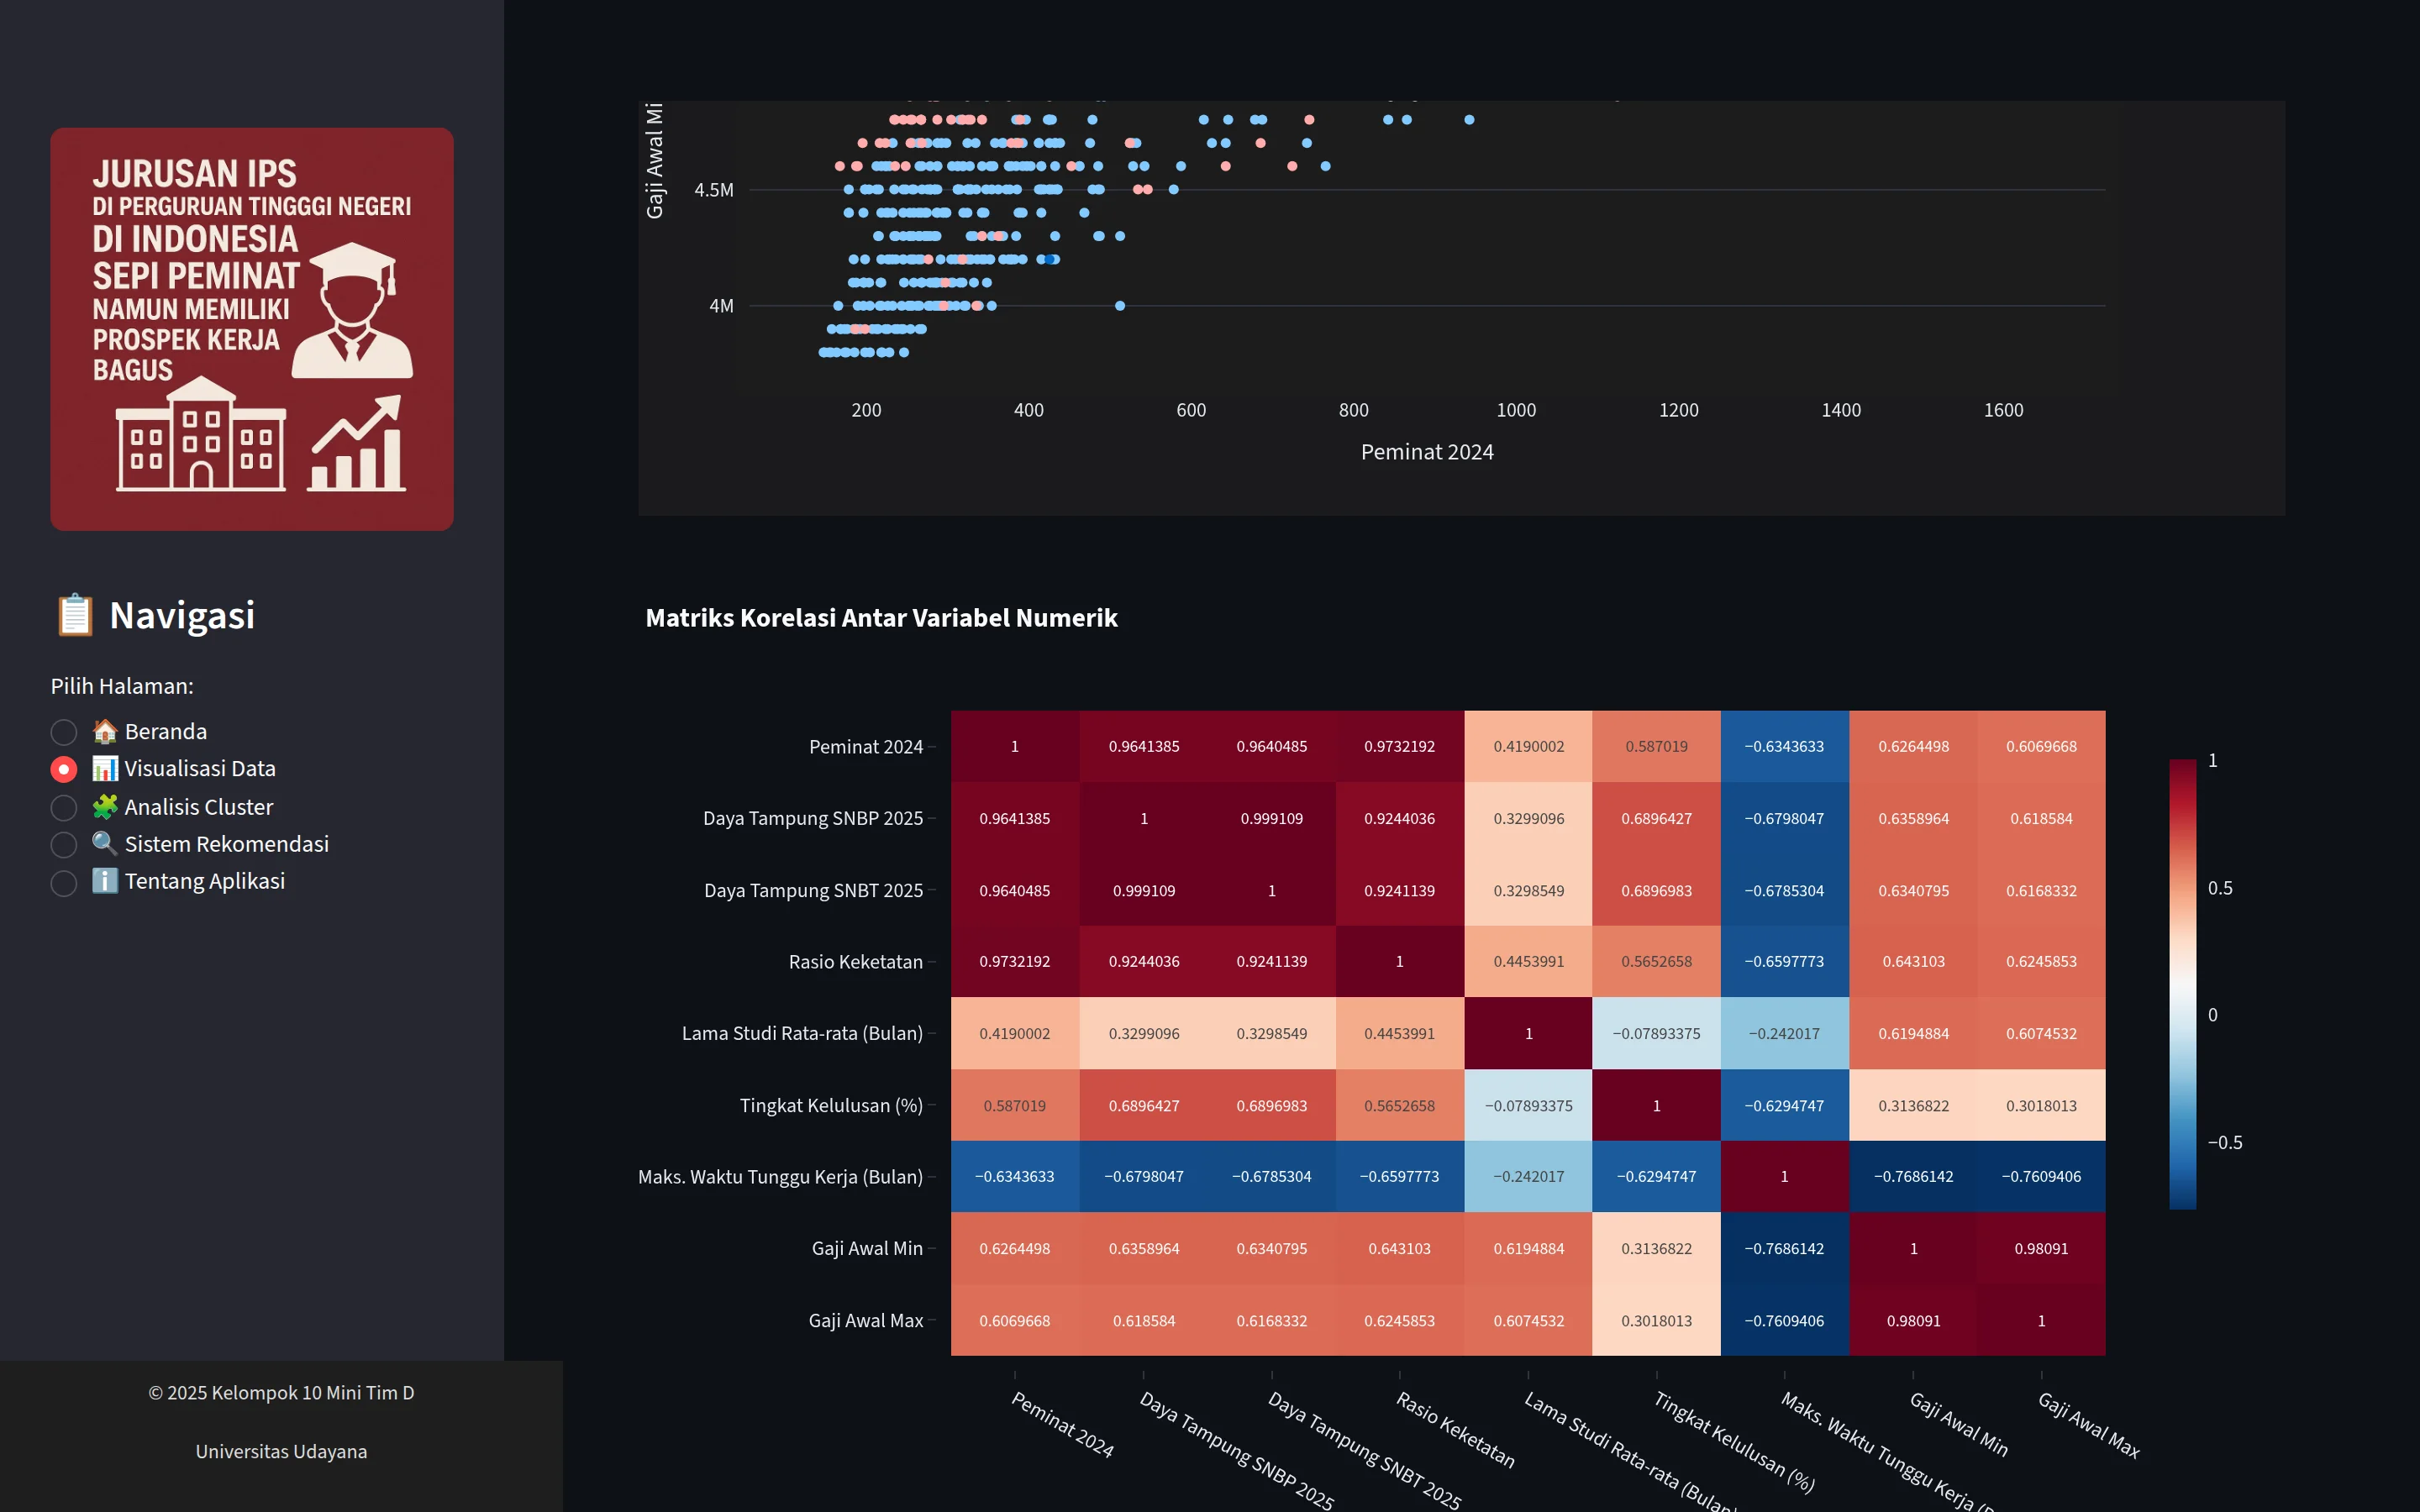
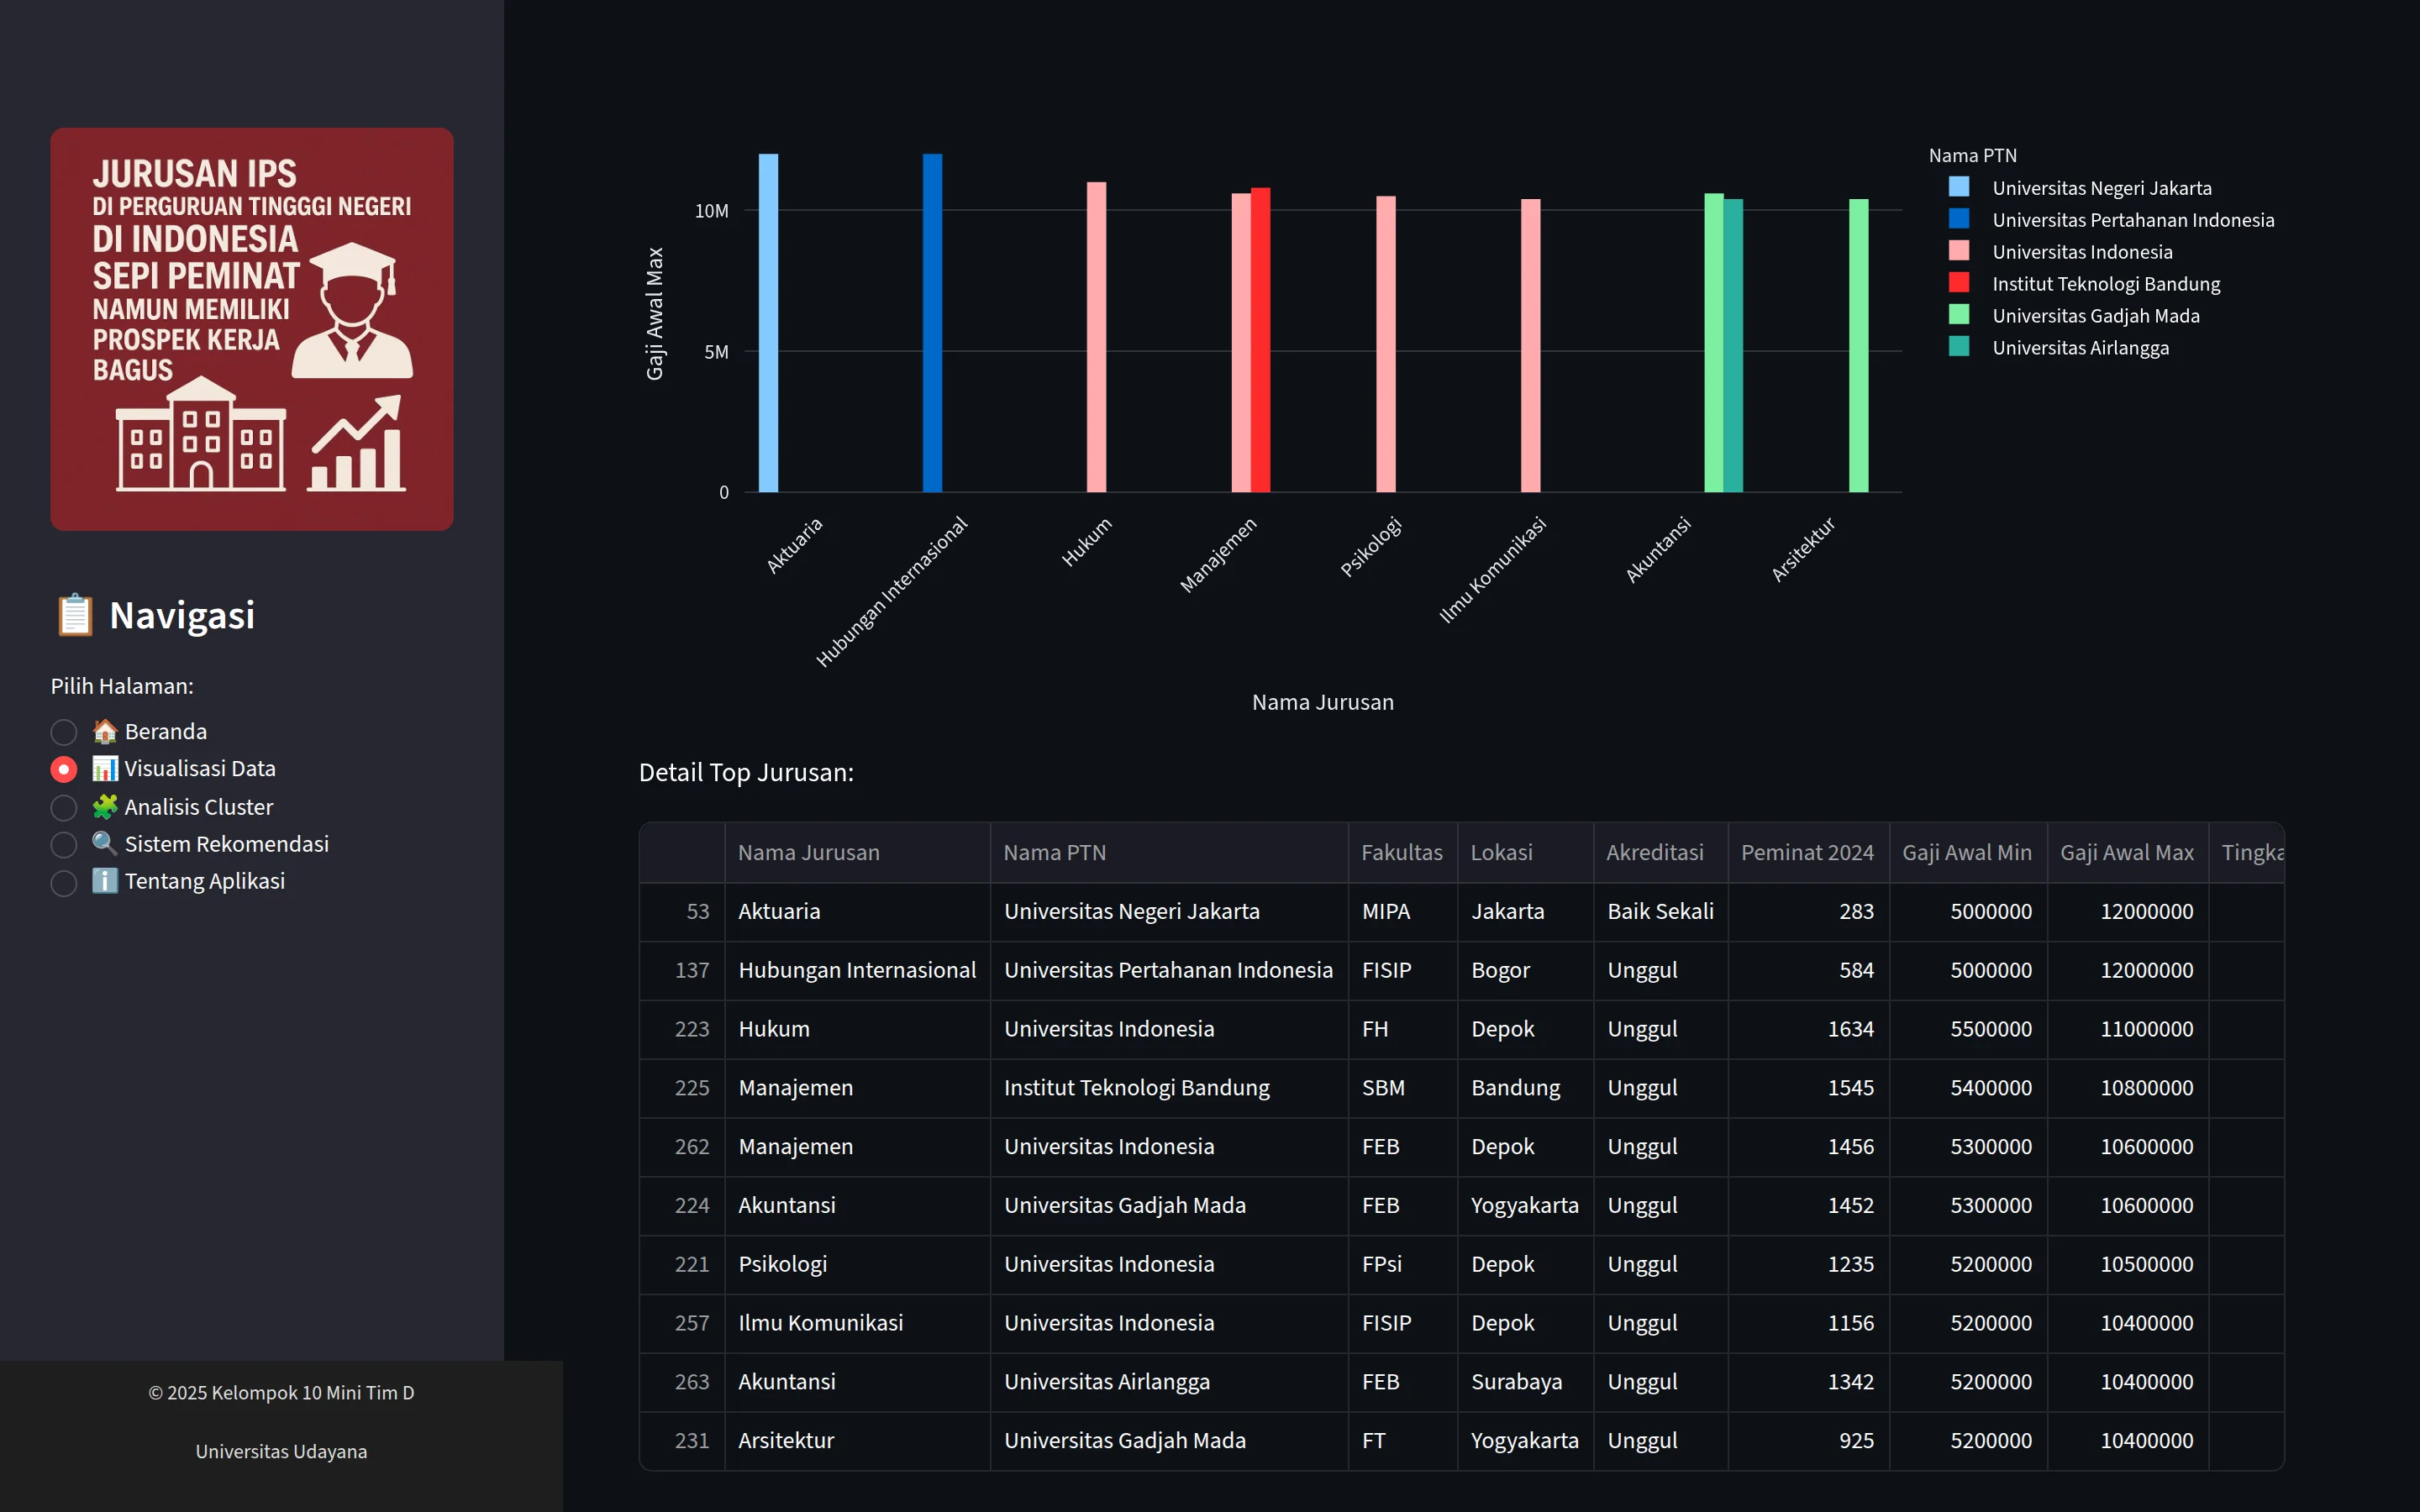
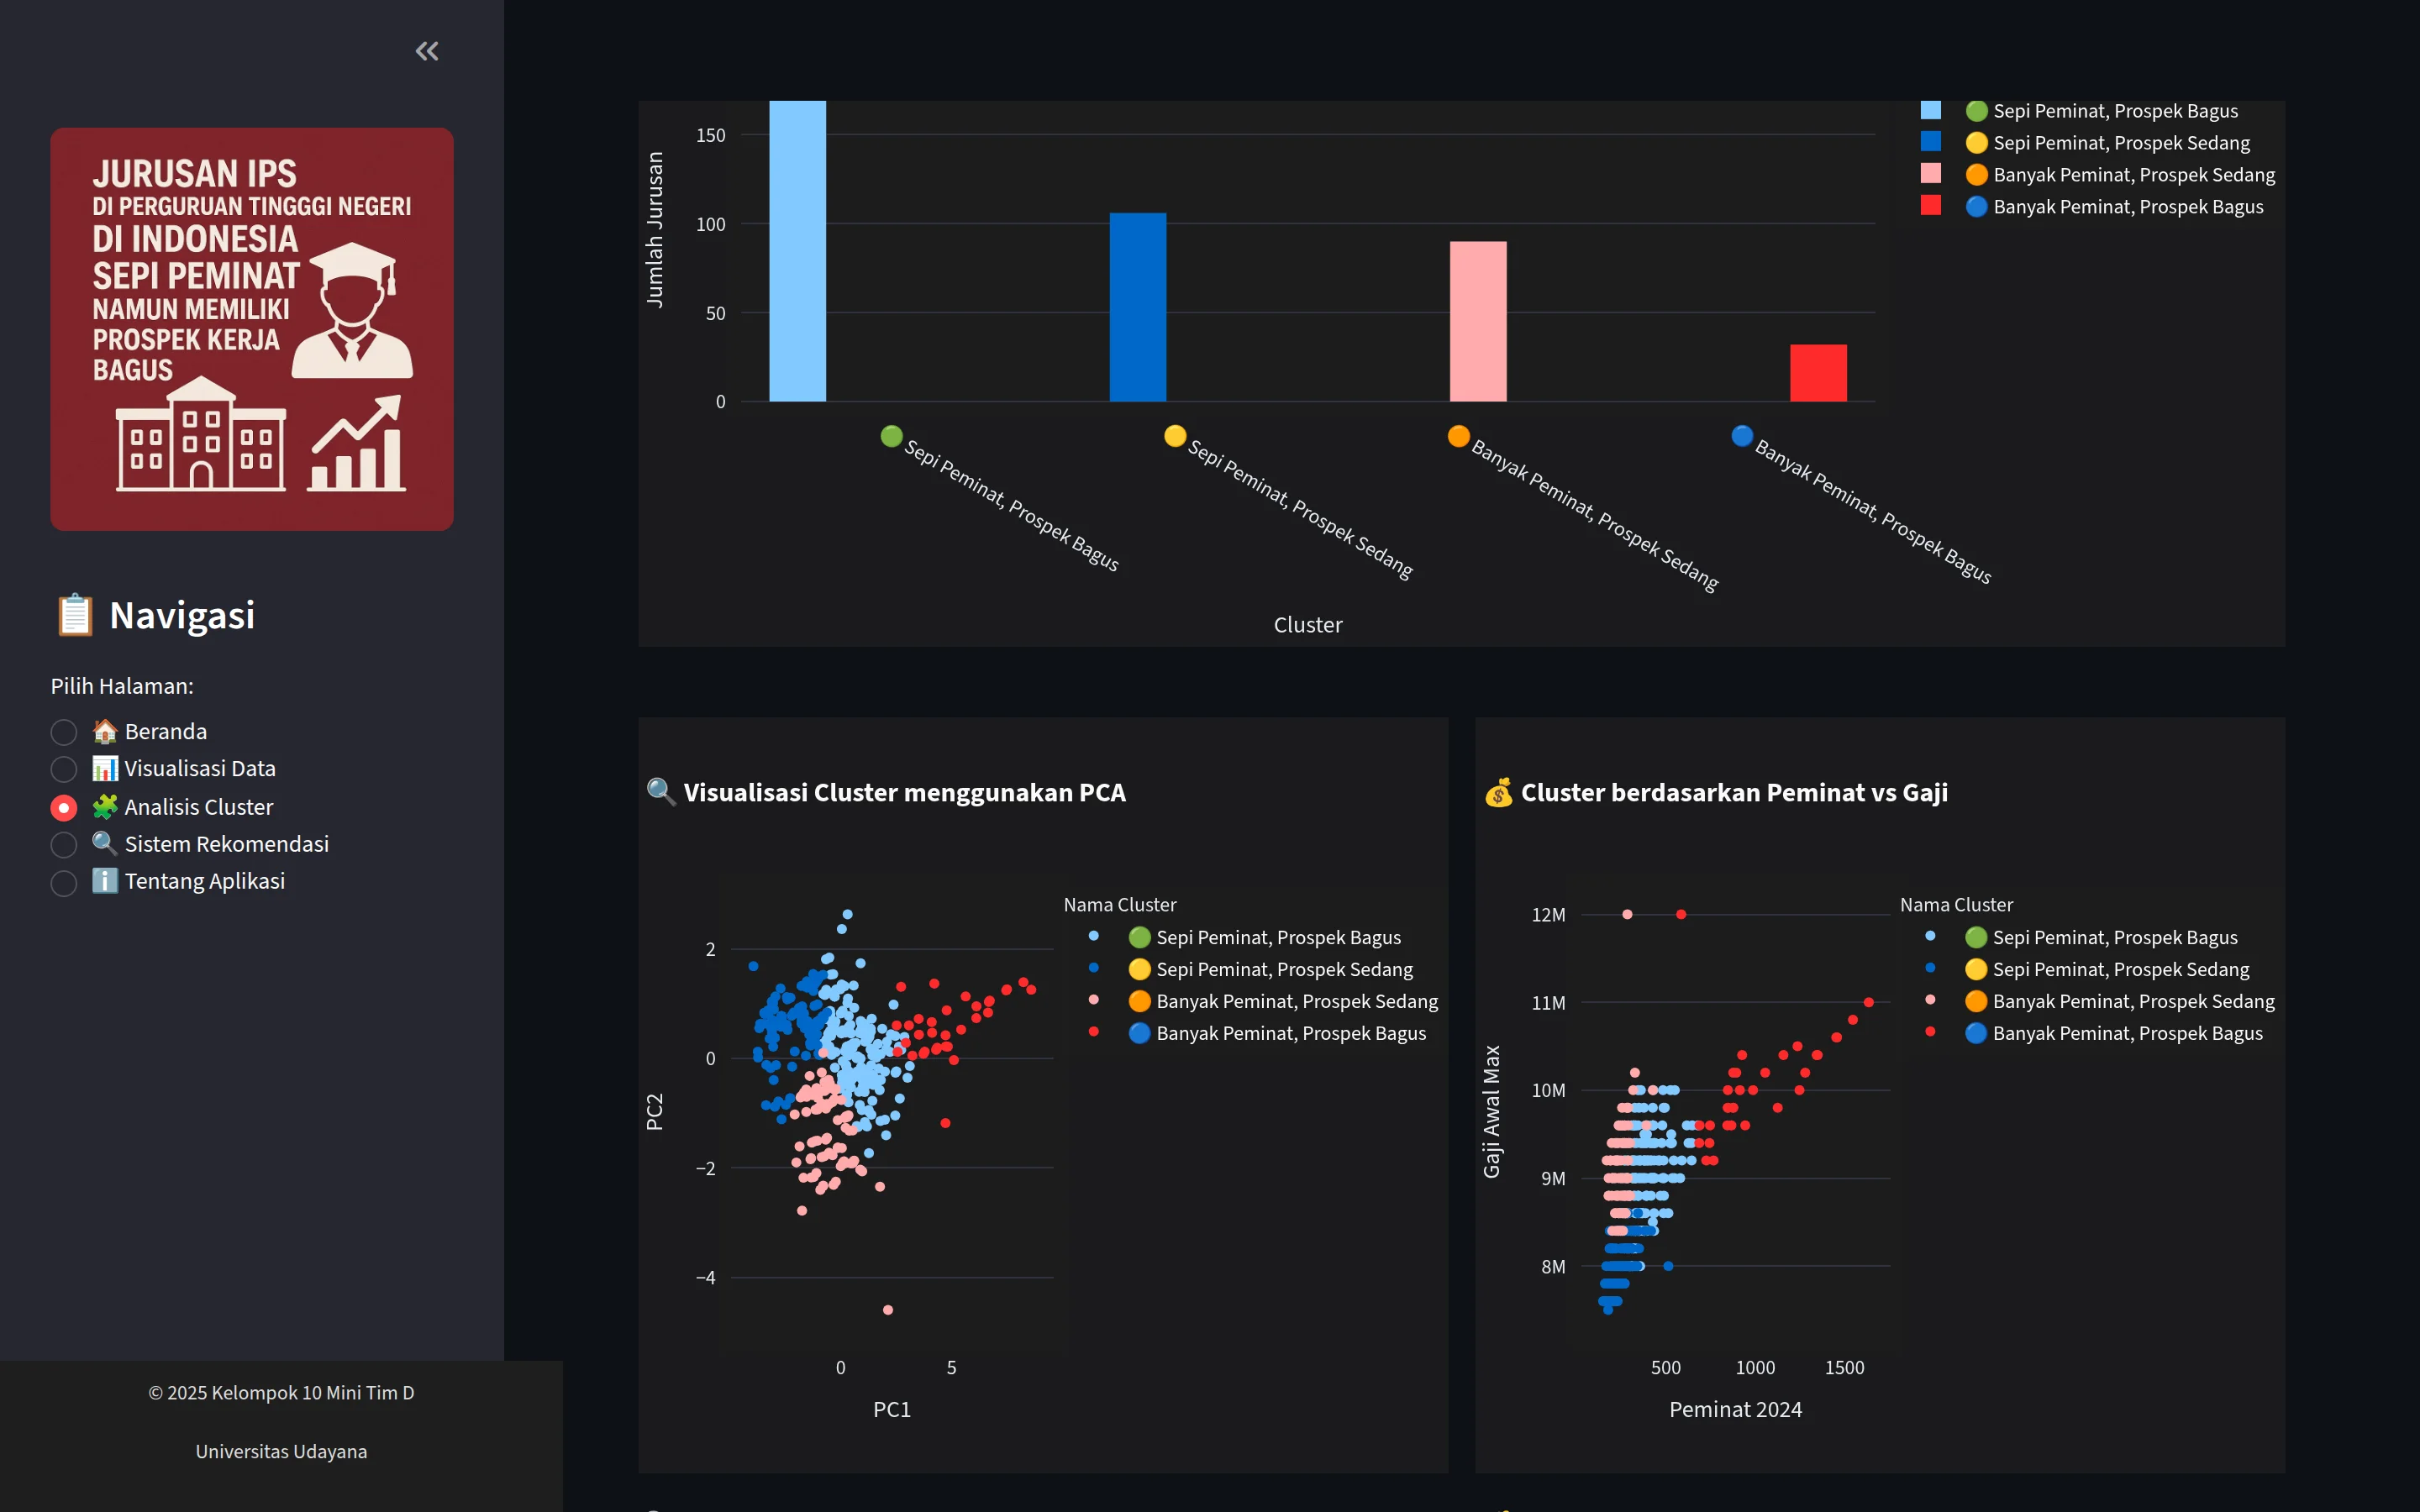
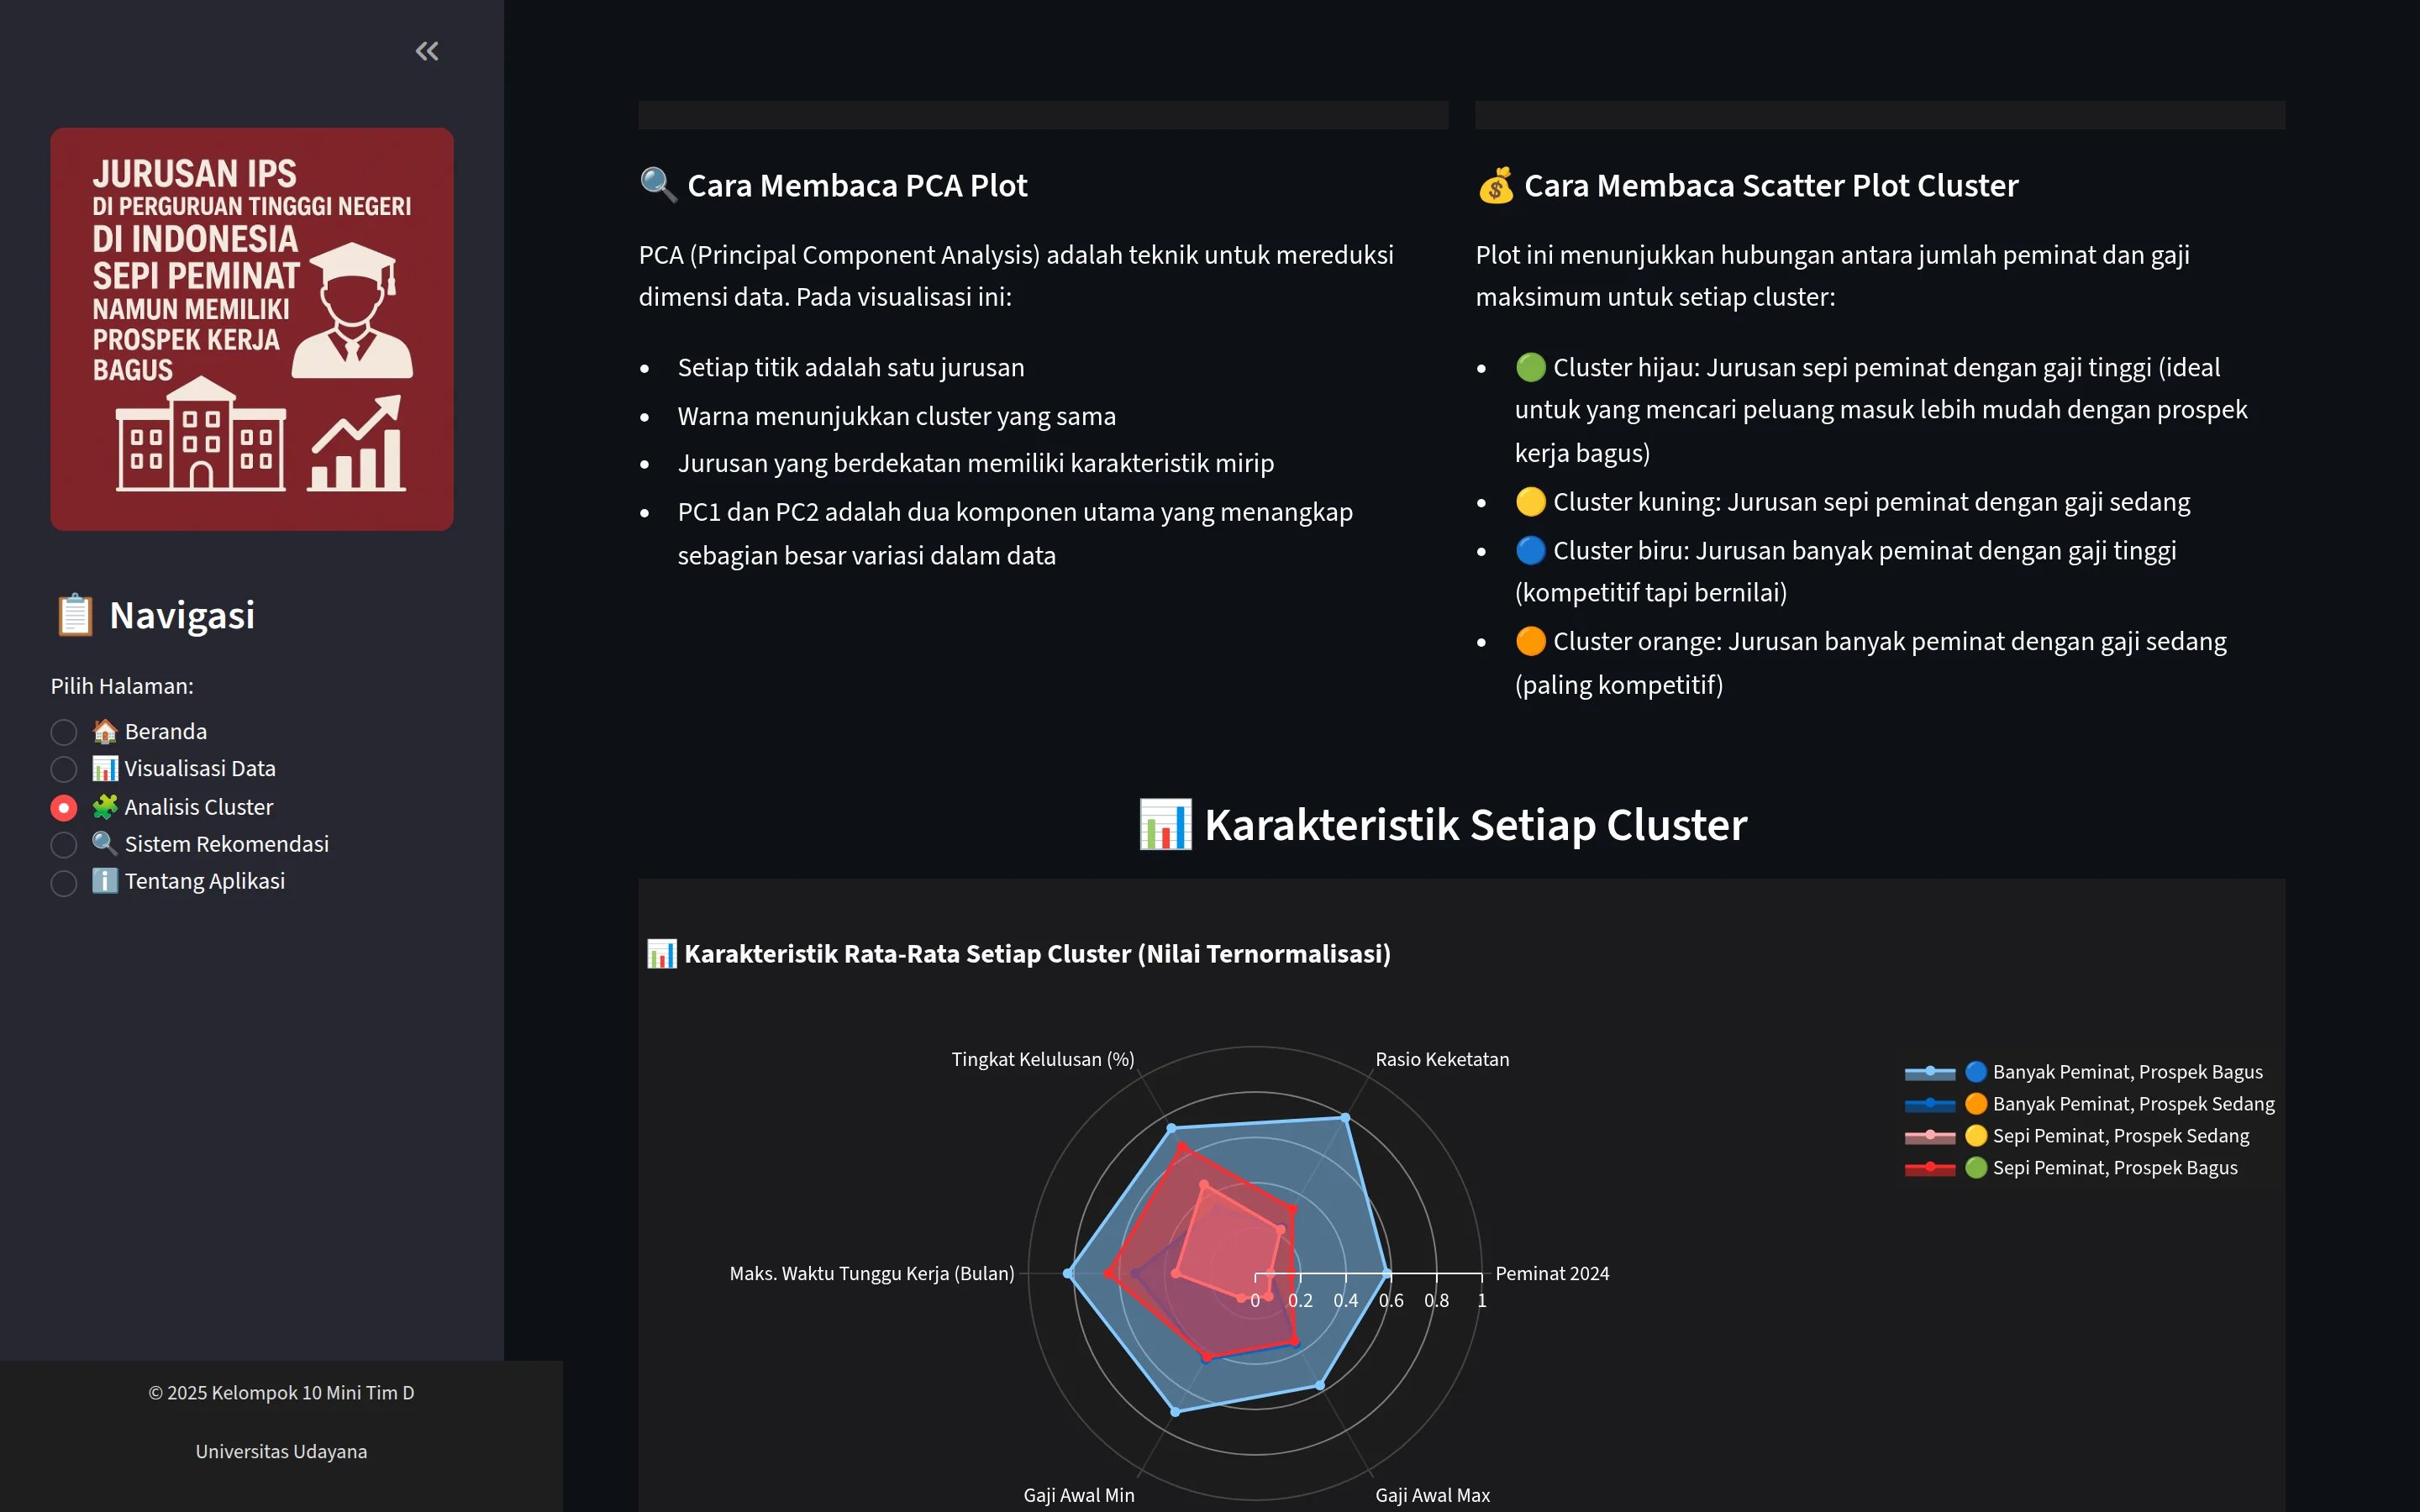
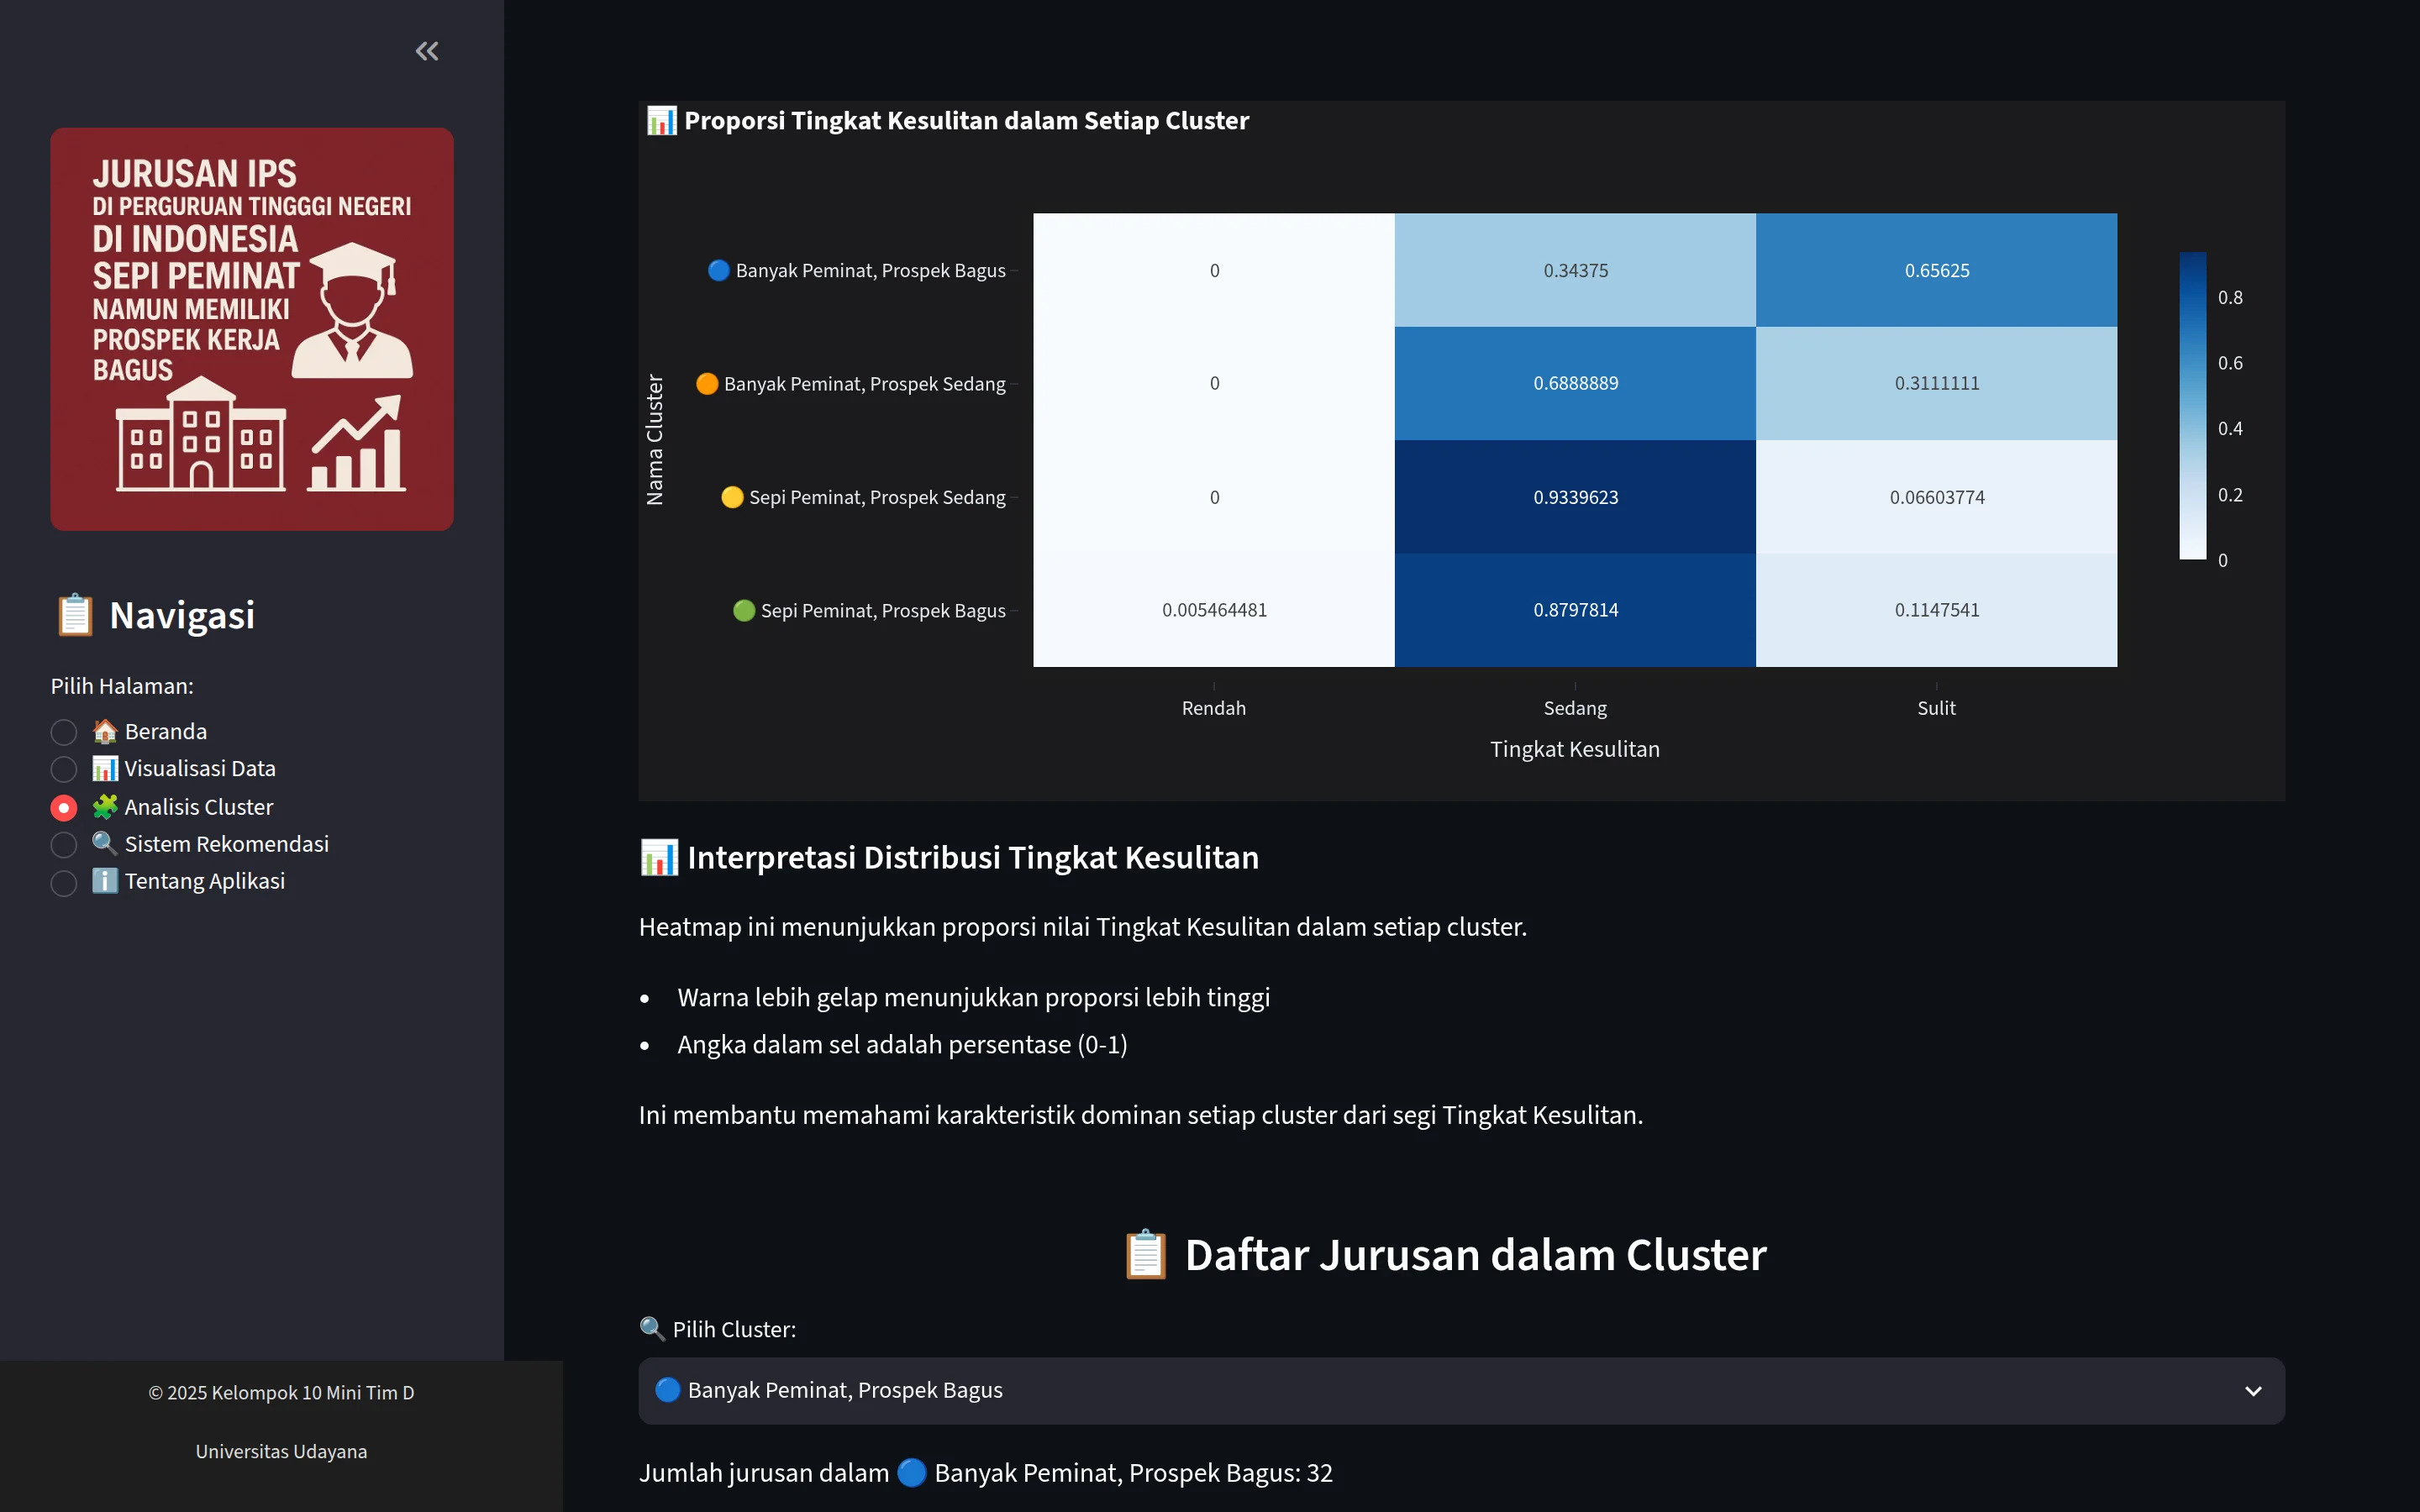
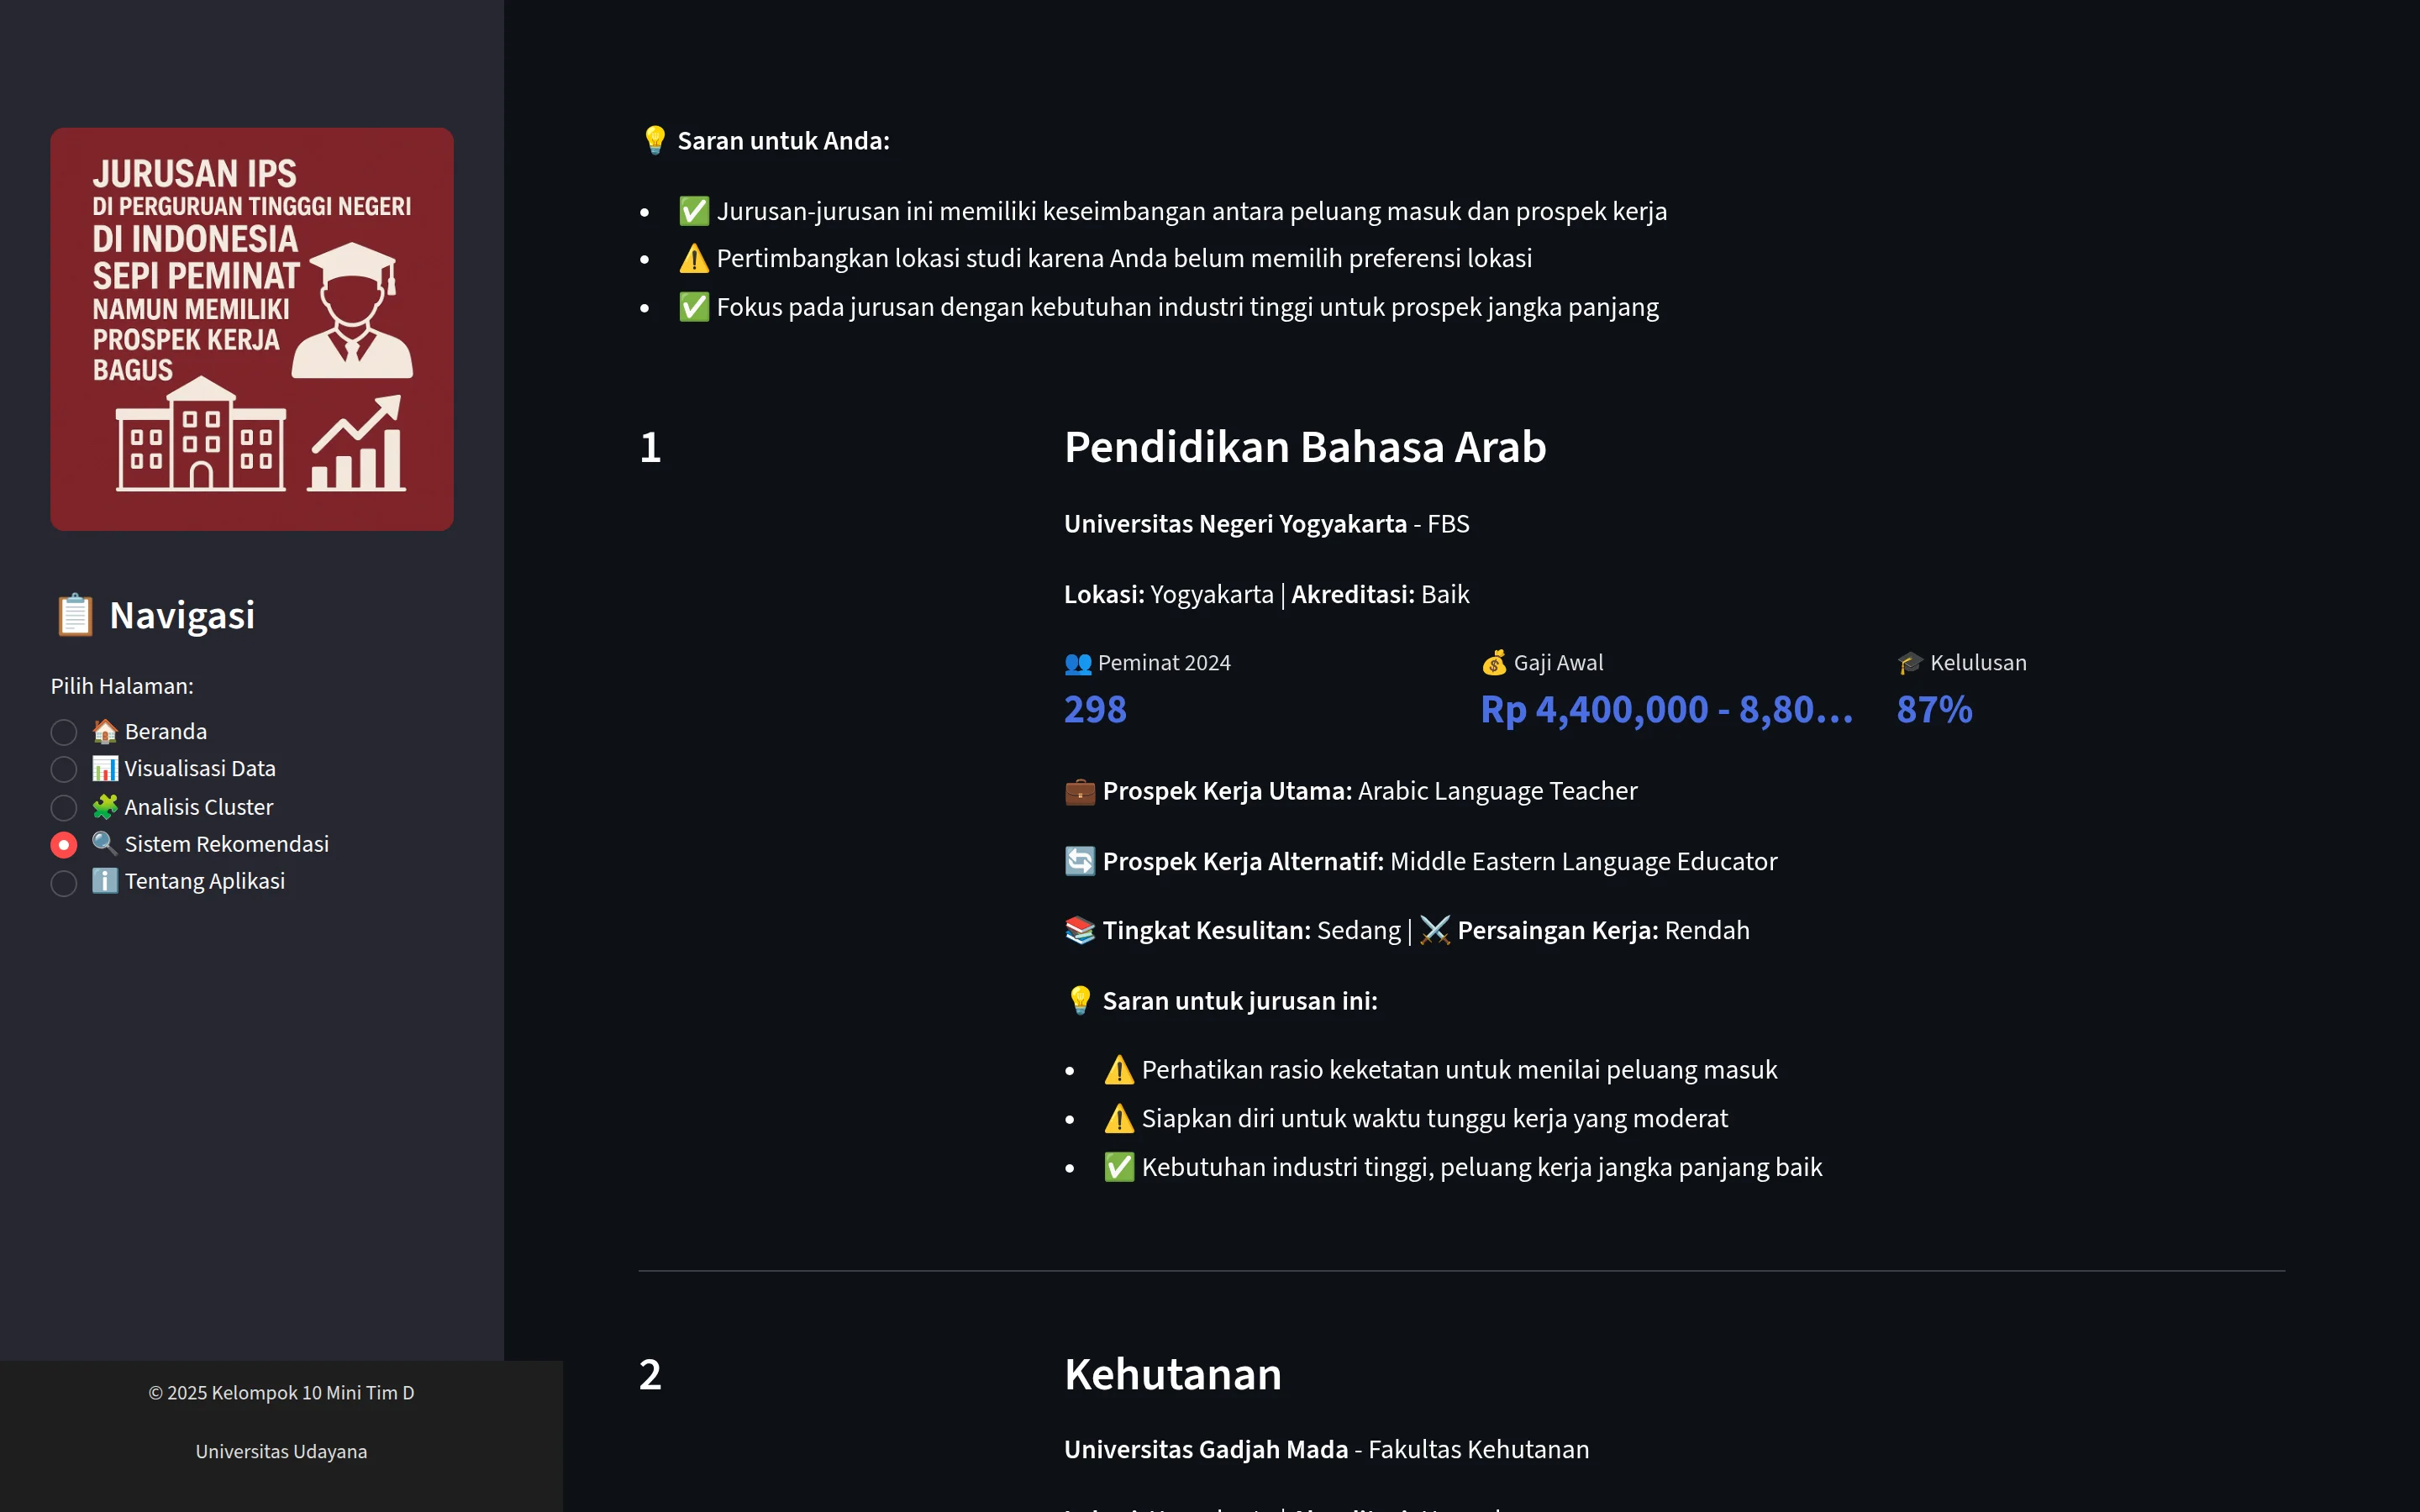
Visualisasi Data page, Hubungan Antar Variabel tab: X, Y and color selectors above a scatter of 2024 applicants against minimum starting salary, colored by difficulty level.Correlation matrix heatmap of the numeric study-program features below the applicant and salary scatter.Top Jurusan tab: top 10 study programs bar chart by university with a detail table listing programs such as Aktuaria and Hubungan Internasional.Analisis Cluster page: study-program count per K-Means cluster, a PCA cluster scatter and a cluster scatter of applicants against salary.Guide to reading the PCA and scatter charts above a radar chart comparing the characteristics of each cluster.Heatmap of difficulty-level proportions per cluster with interpretation notes and a study-program list selector for each cluster.Sistem Rekomendasi results: ranked study-program cards showing 2024 applicants, starting salary range and graduation rate.
(Next project)

Polkadot.js Interface →